With the U.S. economy relying heavily on clearing out freight bottlenecks up and down the supply chain, the White House on Wednesday started a twice-monthly dashboard featuring key performance indicators to measure progress.
Metrics used in the dashboard, compiled by the Biden administration’s Supply Chain Disruptions Task Force, include ships at anchor at the ports of Los Angeles and Long Beach, cumulative container import volume and retail inventories.
The White House said it plans to publish the data at least until the end of the year.
“Our commitment to tackle bottlenecks and inefficiencies is aimed at helping to get goods to the families and businesses that need them as our economy continues to recover from the pandemic,” the White House noted in a blog post. “We will also continue to closely watch the rotation from goods to services consumption, as we expect that rotation to ease pressures on the goods movement supply chain.”
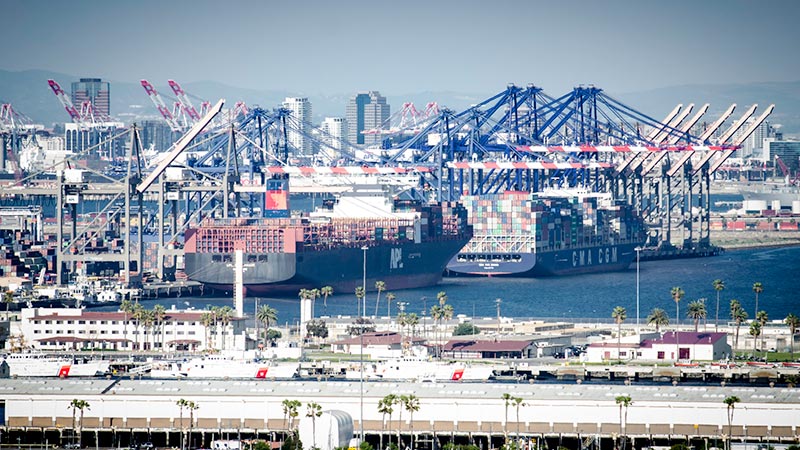
As of Friday, there were 75 container ships at anchor in San Pedro Bay waiting to berth at the two ports, according to the White House, still at near-record levels. “This number is partly driven by consumer demand for goods and also impacted by delta-related port and factory shutdowns in Asia,” the White House stated.
Comparing cumulative import volume, however, shows that more containers are moving across the ports, through warehouses and into stores, the White House asserted. It pointed out that container import volume at the two ports reached 7.7 million twenty-foot equivalent units between January and September — 18% higher than during the same period in 2018, the previous record.
“It’s not enough to move goods into the country — we also need to make sure that we get them on shelves,” the White House noted. It is using data from both the U.S. Census Bureau and the IRI Supply Index to track progress further down the supply chain.
Inflation-adjusted retail inventories (excluding autos) grew between the end of August and the end of September, according to federal census data. At the end of September, retail inventories were 4% higher than they were a year ago and are above pre-pandemic levels.
The latest IRI Supply Index also shows that the rate of keeping goods in stock at retail stores is 89%, which is near the pre-pandemic level of 91%. “These higher-frequency data measures also suggest that, as recently as last week, there had been no deterioration in retail inventories since the census reported the end of September retail inventory numbers,” according to the White House.
In announcing the new dashboard, the administration took the opportunity to point out recent actions it has taken to alleviate congestion, including pushing ports to move to 24/7 operations and a $5 billion partnership between the U.S. Department of Transportation and California ports for expansion projects.
For U.S. exporters that have been tripped up by the influx of imports at the expense of containers available for shipping to Asian markets, however, progress is slow.
At a supply chain hearing Wednesday on Capitol Hill, Mike Durkin, testifying on behalf of the International Dairy Foods Association, said that skyrocketing transportation costs and fees charged by the container lines are resulting in market share to other countries.
“The order by the Biden administration for the ports to work 24/7 was a suggestion for the ports to work toward, but it’s not in place yet,” Durkin said, contending that with port labor negotiations coming up in the spring and the need to hire and train people, he did not expect to see progress for another six to 12 months.
The White House asserted that moving all links in the supply chain simultaneously “doesn’t happen overnight, but the actions being taken by every link in the chain are making a difference. These actions are starting to clear the backlogs and break down the barriers that have made it hard to move this unprecedented volume of goods.”
Fuente:
John Gallagher-https://www.freightwaves.com/news/white-house-starts-publishing-supply-chain-dashboard
